Add a panel with the wizard
The panel wizard builds a visualization from one or more questionnaire calculations.
Requires: Write access to the dashboard, panel editing enabled in your instance, and read access to a questionnaire with chartable calculations.
- Open the dashboard and select its plus (+) button. In Add a panel, select Wizard.
- Questionnaire: search for and select the questionnaire.
- Calculation: select one or more calculations. Each selected calculation provides a series.
- Visualization: choose an offered Chart type and enter a Panel title. Available types depend on the selected calculation.
- Filters: enable Filter by person and Filter by date range where offered. Connect each to an existing Dashboard control or choose Create a new dashboard control.
- Optionally add Cutoff lines with a value, label and colour.
- Set Preview subject to the intended synthetic person and inspect the preview.
- Select Add panel, then save the dashboard.
Keep person and date filters enabled for a dashboard intended to follow one person's results over time. A disabled filter is not connected to a viewer control.
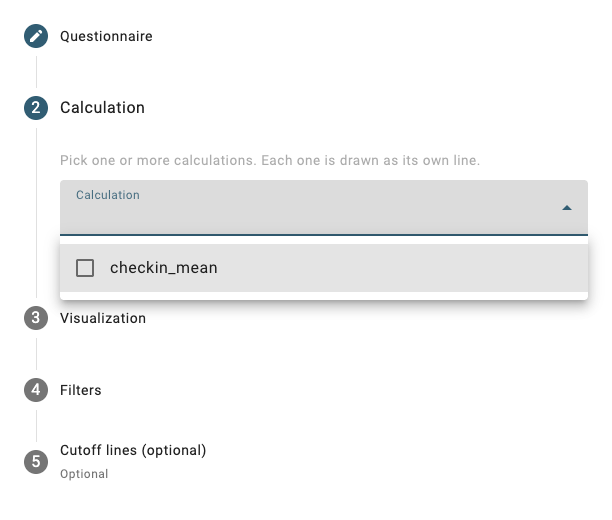
English UI, synthetic configuration. The calculation selector is open.
The preview can default to the most active person with data. Always check its displayed alias; a populated preview does not prove that the current dashboard filters select the same person.
If the calculation list is empty
Create and save a calculation in the questionnaire, then reopen the wizard. The wizard is designed for calculation-based panels. Existing manually configured panels can still be edited.